Have you ever wondered why one river in our region has more water flowing than another river? What accounts for this difference if both rivers have been receiving similar amounts of rainfall? Streamflow, or discharge, is defined as a volume of water moving through a river per unit time. We can use any units of volume and time to express discharge: gallons per minute, liters per hour, teaspoons per fortnight, etc., but, in the U.S., discharge in rivers is usually expressed in cubic feet per second.
There are several factors that affect the discharge of rivers at any given time. These factors include the size of the drainage area (or watershed), climate, land use/land cover, soil type, and the topography of the watershed. Within a given region where most of these factors are similar (e.g., northeastern New York), the size of the watershed is the single factor that explains the majority of the differences in discharge from one river to the next. Most of our readers probably already understand this. On any given day, the Saranac River at Plattsburgh (drainage area: 608 square miles) will have a higher discharge than the Ausable River at Au Sable Forks (drainage area: 446 square miles). Because there is simply more land draining to that point on the Saranac River, it will typically have more discharge. In fact, we can look at all of the various watersheds in our region that are continuously measured by the U.S. Geological Survey and plot the discharge by the watershed size to see how area is the critical factor in determining discharge on a day-to-day basis.
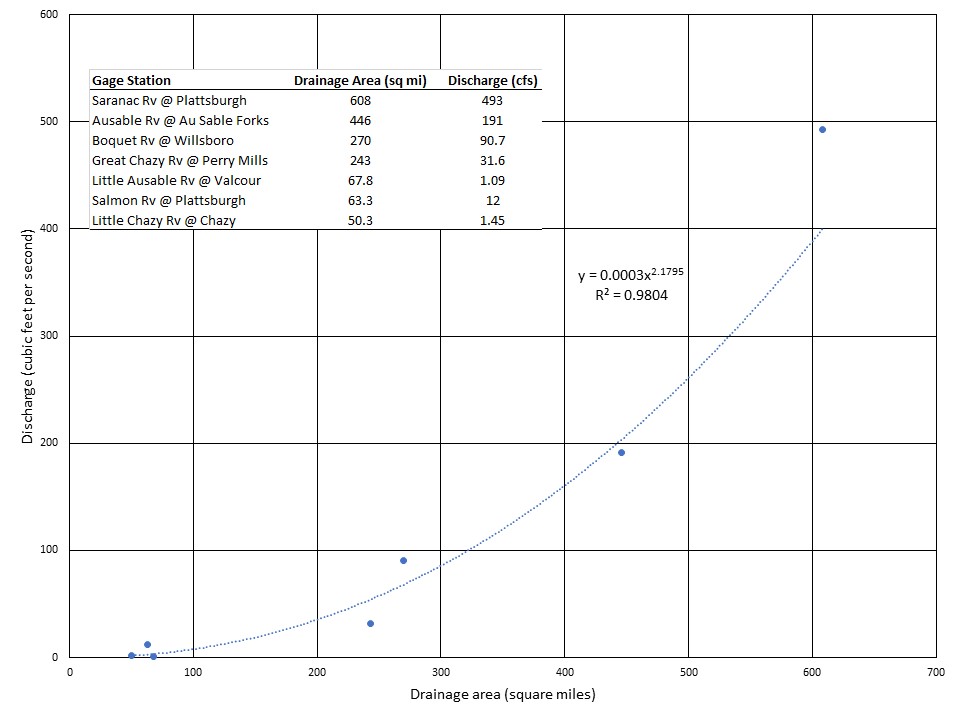
Figure 1. A plot of drainage area vs. discharge for seven rivers in northeastern New York. The discharge was recorded at 8:00 AM on August 17, 2021. The blue-dotted trendline shows the relationship between the two variables. As drainage area increases, there is a corresponding increase in discharge. The R^2 value indicates how well the data fit the trendline. R^2 will range from 0 to 1. Values closer to 0 indicate a poor fit, while values close to 1 indicate a strong relationship between the two variables on the graph.
Support our river restoration work for clean water and healthy streams. Give with confidence today!

It should be noted that these relationships are regional. When comparing discharge of streams in northeastern New York to streams in another region of the country, the differences in climate, soil, topography, etc. will make watershed area less useful as a predictor of discharge. However, these regional relationships are incredibly useful, especially when working with the many ungaged streams or areas upstream of a gaging site where discharge is different due to a decrease in watershed size (i.e., the East Branch Ausable watershed in Jay is larger than the East Branch Ausable watershed in Keene Valley). When we quantify the relationship between area and discharge, as we did in Figure 1, we can use the equation for the slope of the line to estimate discharge in an ungaged stream. Just plug in watershed area for x in the equation of the trendline, and you’ll have a rough estimate of discharge for the stream in question. For example, the equation of the trendline in Figure 1 is y= 0.0003x^2.1795. If we knew that the area of an ungaged watershed was around 80 square miles, we could substitute 80 for x in the equation to estimate a discharge of 4.2 cubic feet per second.
There are some caveats to this method of estimating discharge. August 17, 2021, was chosen for this example because it followed an extended period of dry weather days. Storms, especially isolated storms that pop-up throughout the region, could complicate things with some smaller watersheds having abnormally high discharges due to localized weather not seen in other parts of the region. Additionally, these estimates should be used carefully, with the understanding that estimations are often a poor substitute for careful field measurements due to subtle variations from one stream to another.
In conclusion, this analysis would not be possible if these critical hydrologic data were not collected by the USGS. In an era when gage sites are disappearing due to a lack of funding, it is important that this work is allowed to continue. Statistical analyses based on past data may not be valid in a changing climate. The observations that are made today will be the foundation for efforts to improve stream health and flood resilience for decades to come.
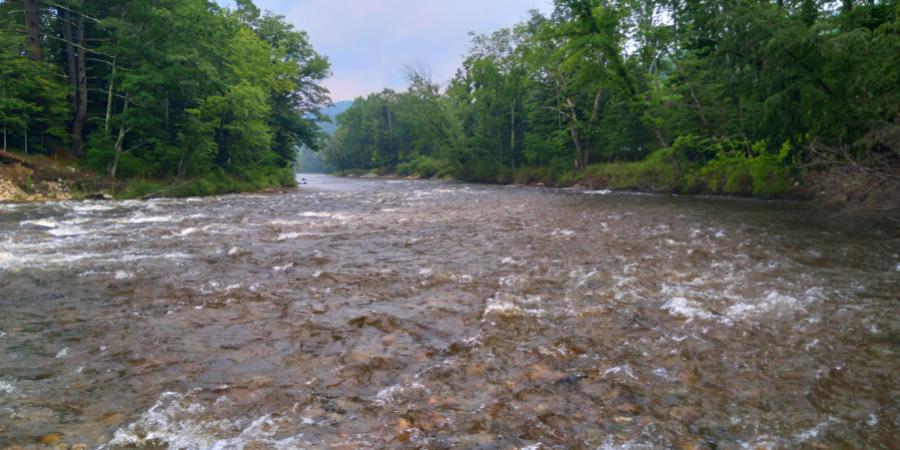
Story, diagrams, and photo by Gary Henry, Stream Restoration Manager. Top photo: A rainy day on the East Branch Ausable River
Sign-up for our e-newsletter to get weekly updates on the latest stories from the Ausable River Association.