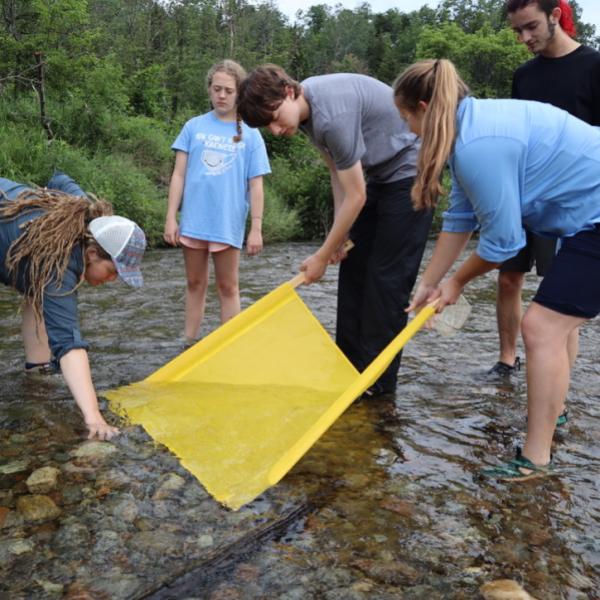
Flow duration curves (FDC) are a useful way to compare the discharge of different river systems. FDCs represent the percentage of time that a particular size discharge is equaled or exceeded. To prepare the FDCs in this study, the daily discharge values measured at each U.S. Geological Survey (USGS) stream gage site in the Ausable Watershed were ranked from highest to lowest. A statistical analysis was conducted to find the probability of a given flow being equaled or exceeded based on years of observation. In theory, an FDC can be constructed from any length of record, but it is most useful for rivers with at least 10 years of continuous measurement.
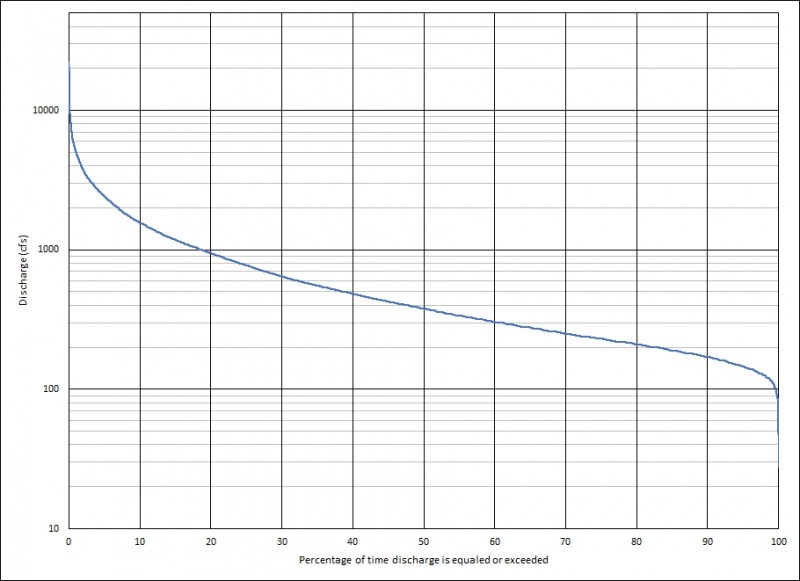
A flow duration curve of the Main Stem Ausable River measured at Au Sable Forks from 1910 to 1968 and from 1990 to 2020. Daily discharge was not recorded between 1968 and 1990. The diagram shows that a discharge of 380 cubic feet per second (cfs) is equaled or exceeded 50% of the time. High daily flows above 10,000 cfs are rare and only exceeded (thankfully) about 0.1% of the time. At the other extreme, daily flows of 100 cfs are exceeded about 99.6% of the time.
To do a proper comparison of FDCs between different watersheds, discharge is normalized by dividing by the area of the watershed. It is similar to how we might compare the economy of the U.S. to a smaller country, like the U.K. We can’t simply compare gross domestic product (GDP) of the two countries because the U.S. has a much larger population, so we normalize GDP by population to get per capita GDP. If we compare the discharge of the Main Stem Ausable River to the West Branch, the Main Stem’s discharge is always going to be larger because its watershed is larger. However, if we divide the discharge in each watershed by its respective area, we can see how these discharges compare to each other. In this analysis, only discharges covering the same period of record were used. For example, if the USGS was measuring flow in the Main Stem in 1991 but not in the West Branch, that year was not used in the comparative analysis. Since FDCs represent the annual fluctuations in discharge, only complete water years (Oct.1 to Sept. 30) were utilized to construct the curves.
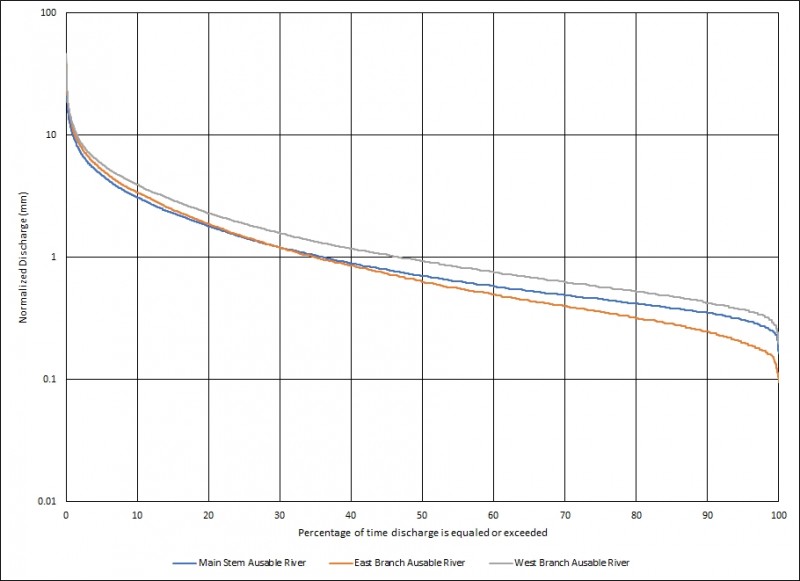
A comparison of flow duration characteristics of the East Branch (at Au Sable Forks), West Branch (near Lake Placid), and Main Stem Ausable River (near Au Sable Forks) stream gages normalized by area. Only the years 1925 to 1968 were used in the analysis due to the lack of overlapping data among all three locations at other times.
Support our river restoration work for clean water and healthy streams. Give with confidence today!

The above diagram shows that the West Branch has relatively higher normalized discharges compared to the other watersheds. This would indicate that a given amount of rainfall would typically produce more runoff in the West Branch watershed. There are a number of factors that can affect runoff, including slope, soil type, and land cover. Further analysis will help determine which of these factors might be responsible for this characteristic of the West Branch. As would be expected, the Main Stem FDC fits between the East Branch and West Branch curves since it is reflective of flows from both the East and West Branches. However, it is not simply an average of the two tributary watersheds. This is because the East Branch watershed at the USGS gage has an area of 198 square miles while the West Branch watershed at the USGS gage has an area of 116 square miles. The Main Stem gage station has a watershed area of 446 square miles (see map below). It is interesting that at flows above 40% duration, the East Branch and Main Stem have similar normalized discharge characteristics. As the analysis is ongoing, the causes of the similarities and differences between these three watersheds have yet to be conclusively determined. Perhaps the subject of a future story…
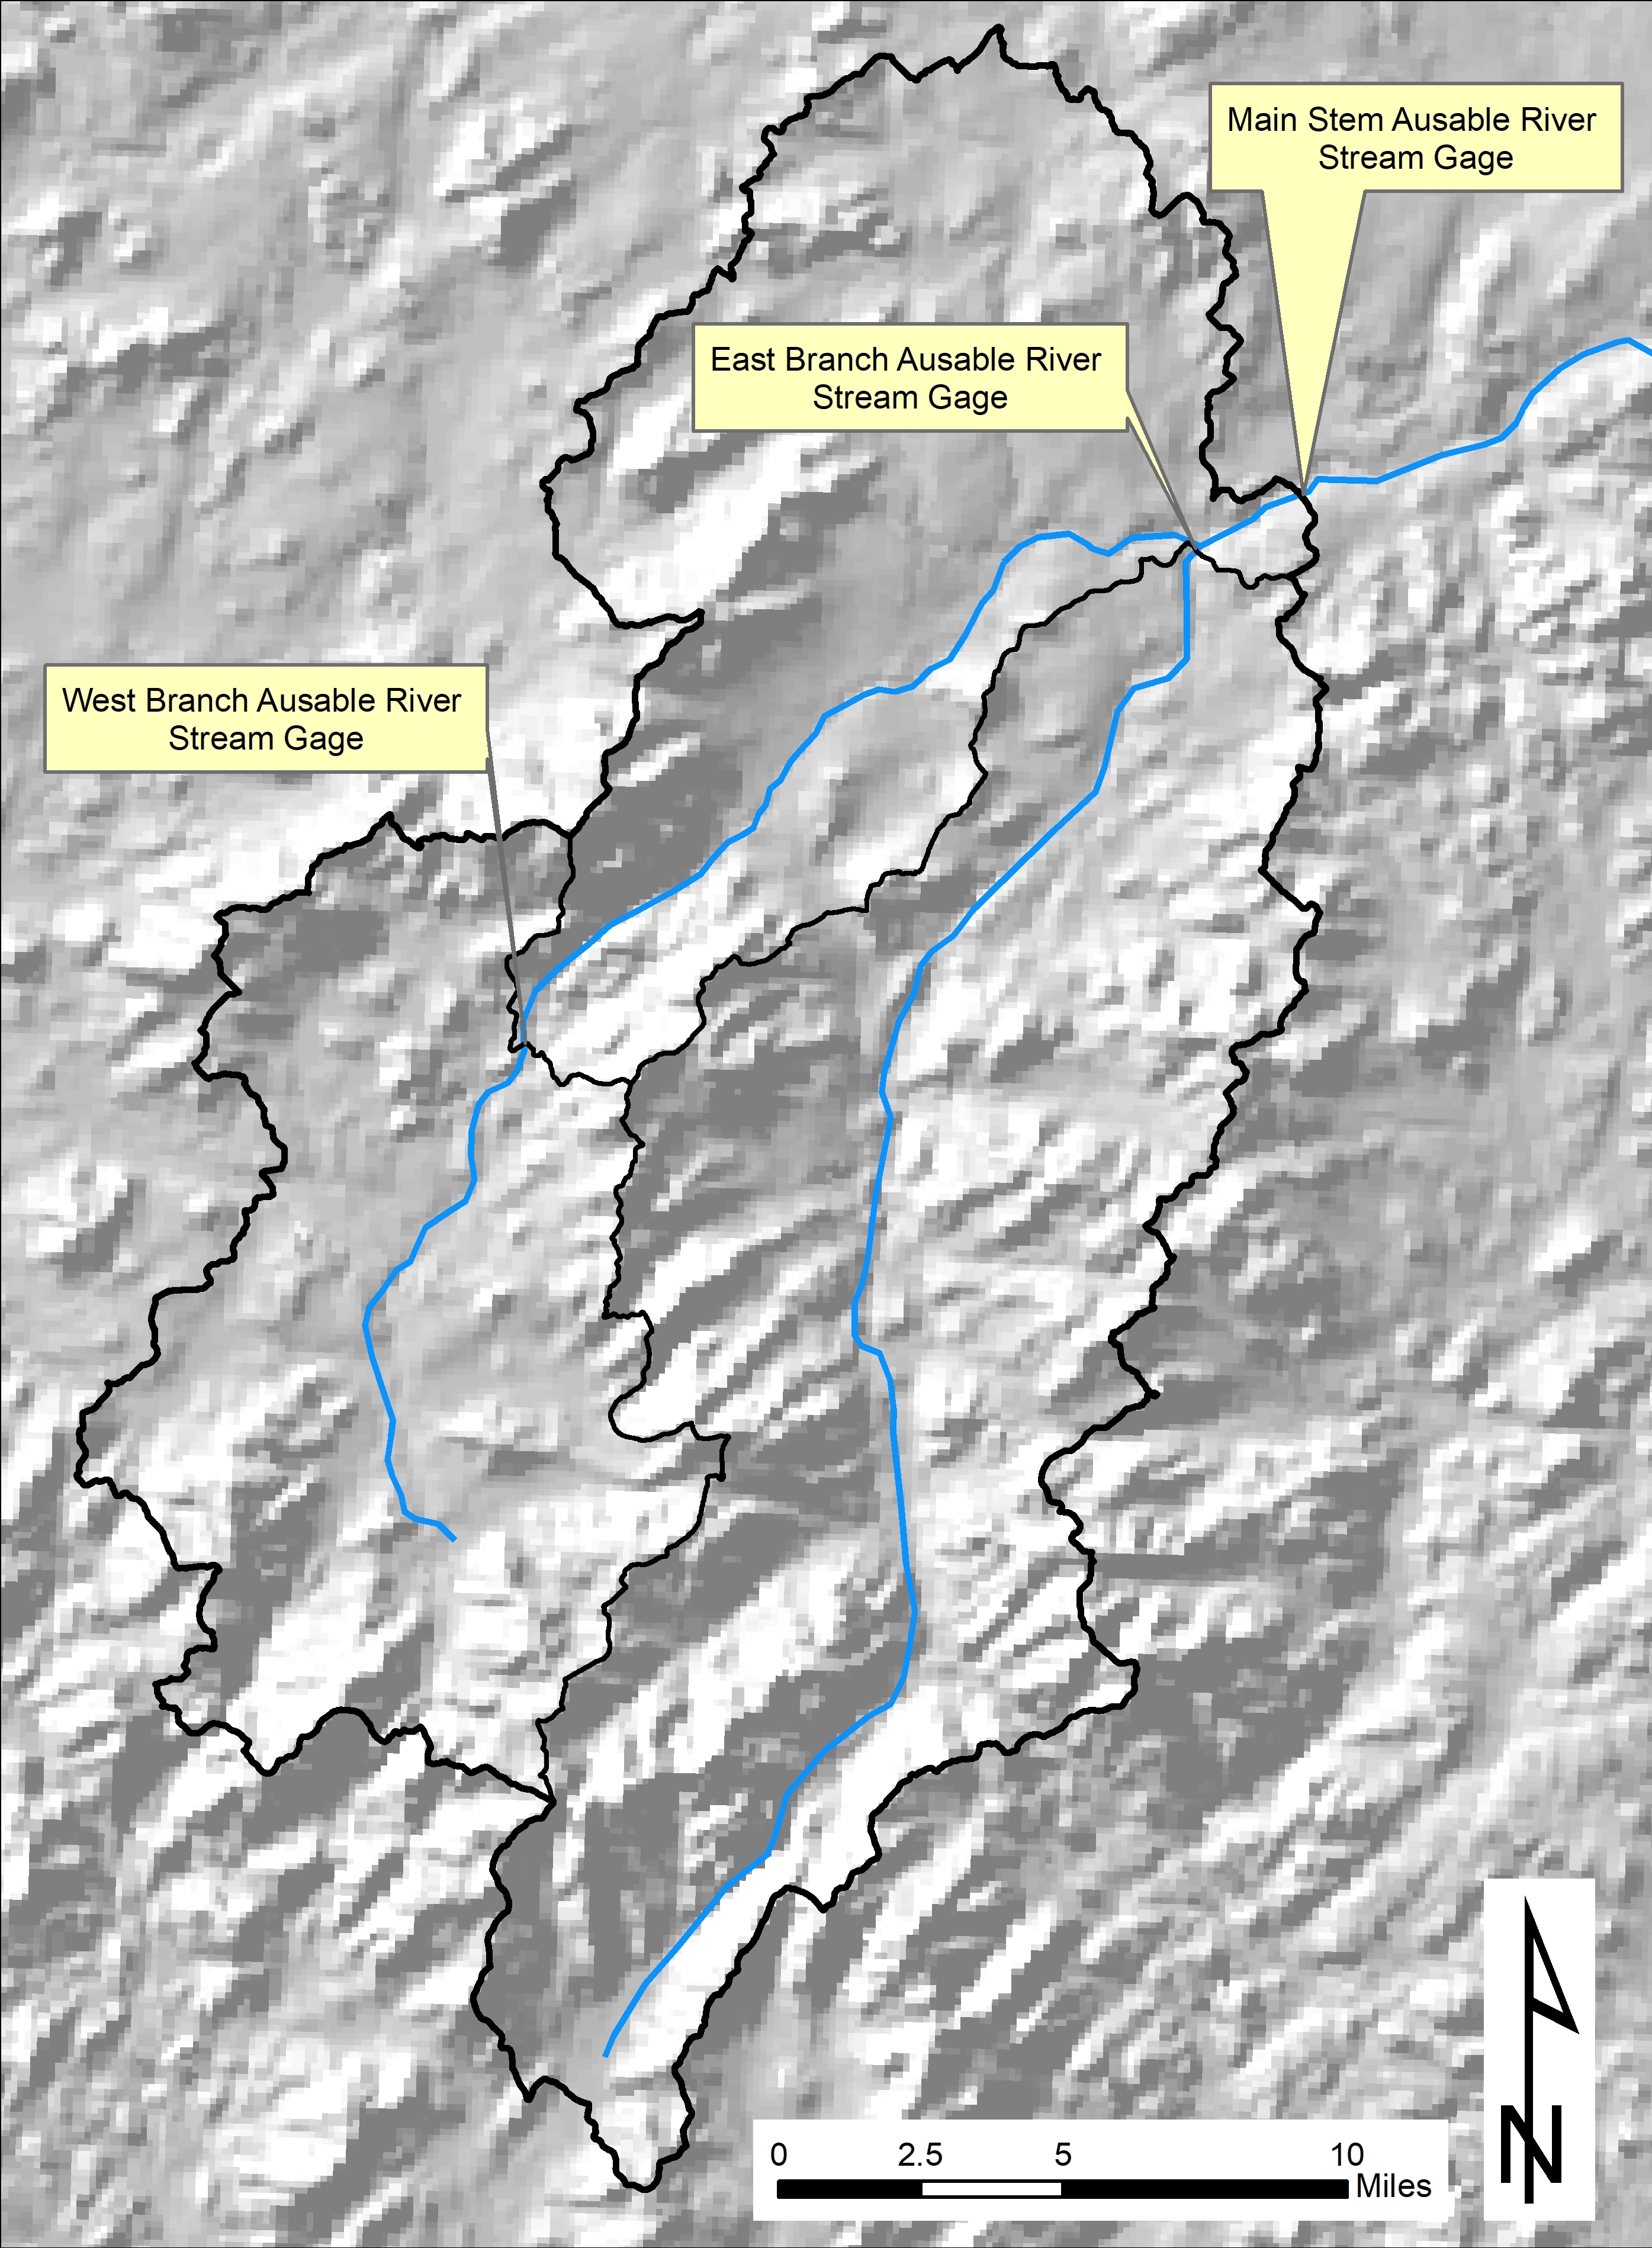
Map showing the locations of USGS stream gages in the Ausable Watershed.
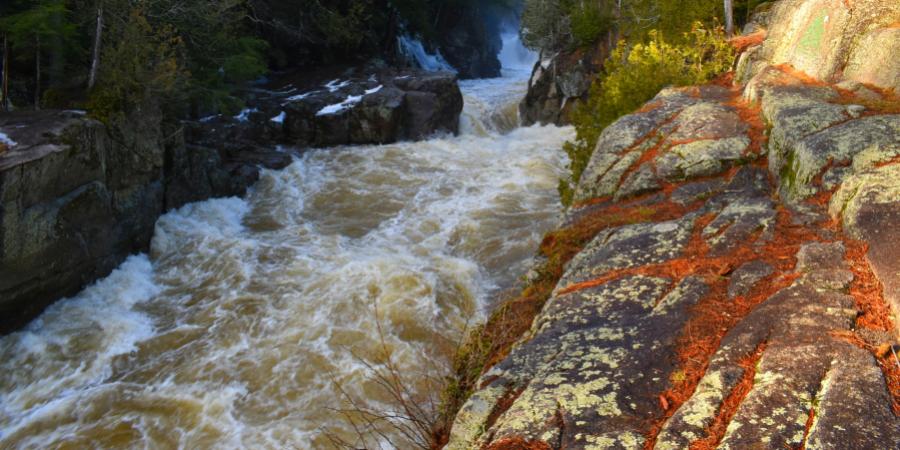
Story, diagrams, photo, and map by Gary Henry, Stream Restoration Manager. Top photo: High discharge at The Flume in Wilmington, Spring 2021.
Sign-up for our e-newsletter to get weekly updates on the latest stories from the Ausable River Association.