The Ausable River Association has been working with our partners, the U.S. Fish and Wildlife Service and The Nature Conservancy, since 2010 to identify and replace aging and undersized culverts. Culverts or bridges are required anywhere a road crosses a stream. Our "right-sized" climate-ready culverts are critical to improving flood resilience, aquatic species passage, and stream health in our watersheds.
The design of a climate-ready culvert begins with a detailed survey to identify key characteristics of the stream that passes through the culvert. These characteristics include, but are not limited to, the slope of the channel, bankfull discharge indicators, and representative cross sections. Improperly sized culverts can cause significant damage to streams on both the upstream and downstream ends of an undersized pipe. The map below shows an example of a stream that was recently surveyed in the Boquet watershed for the purpose of replacing an undersized and deteriorating culvert.
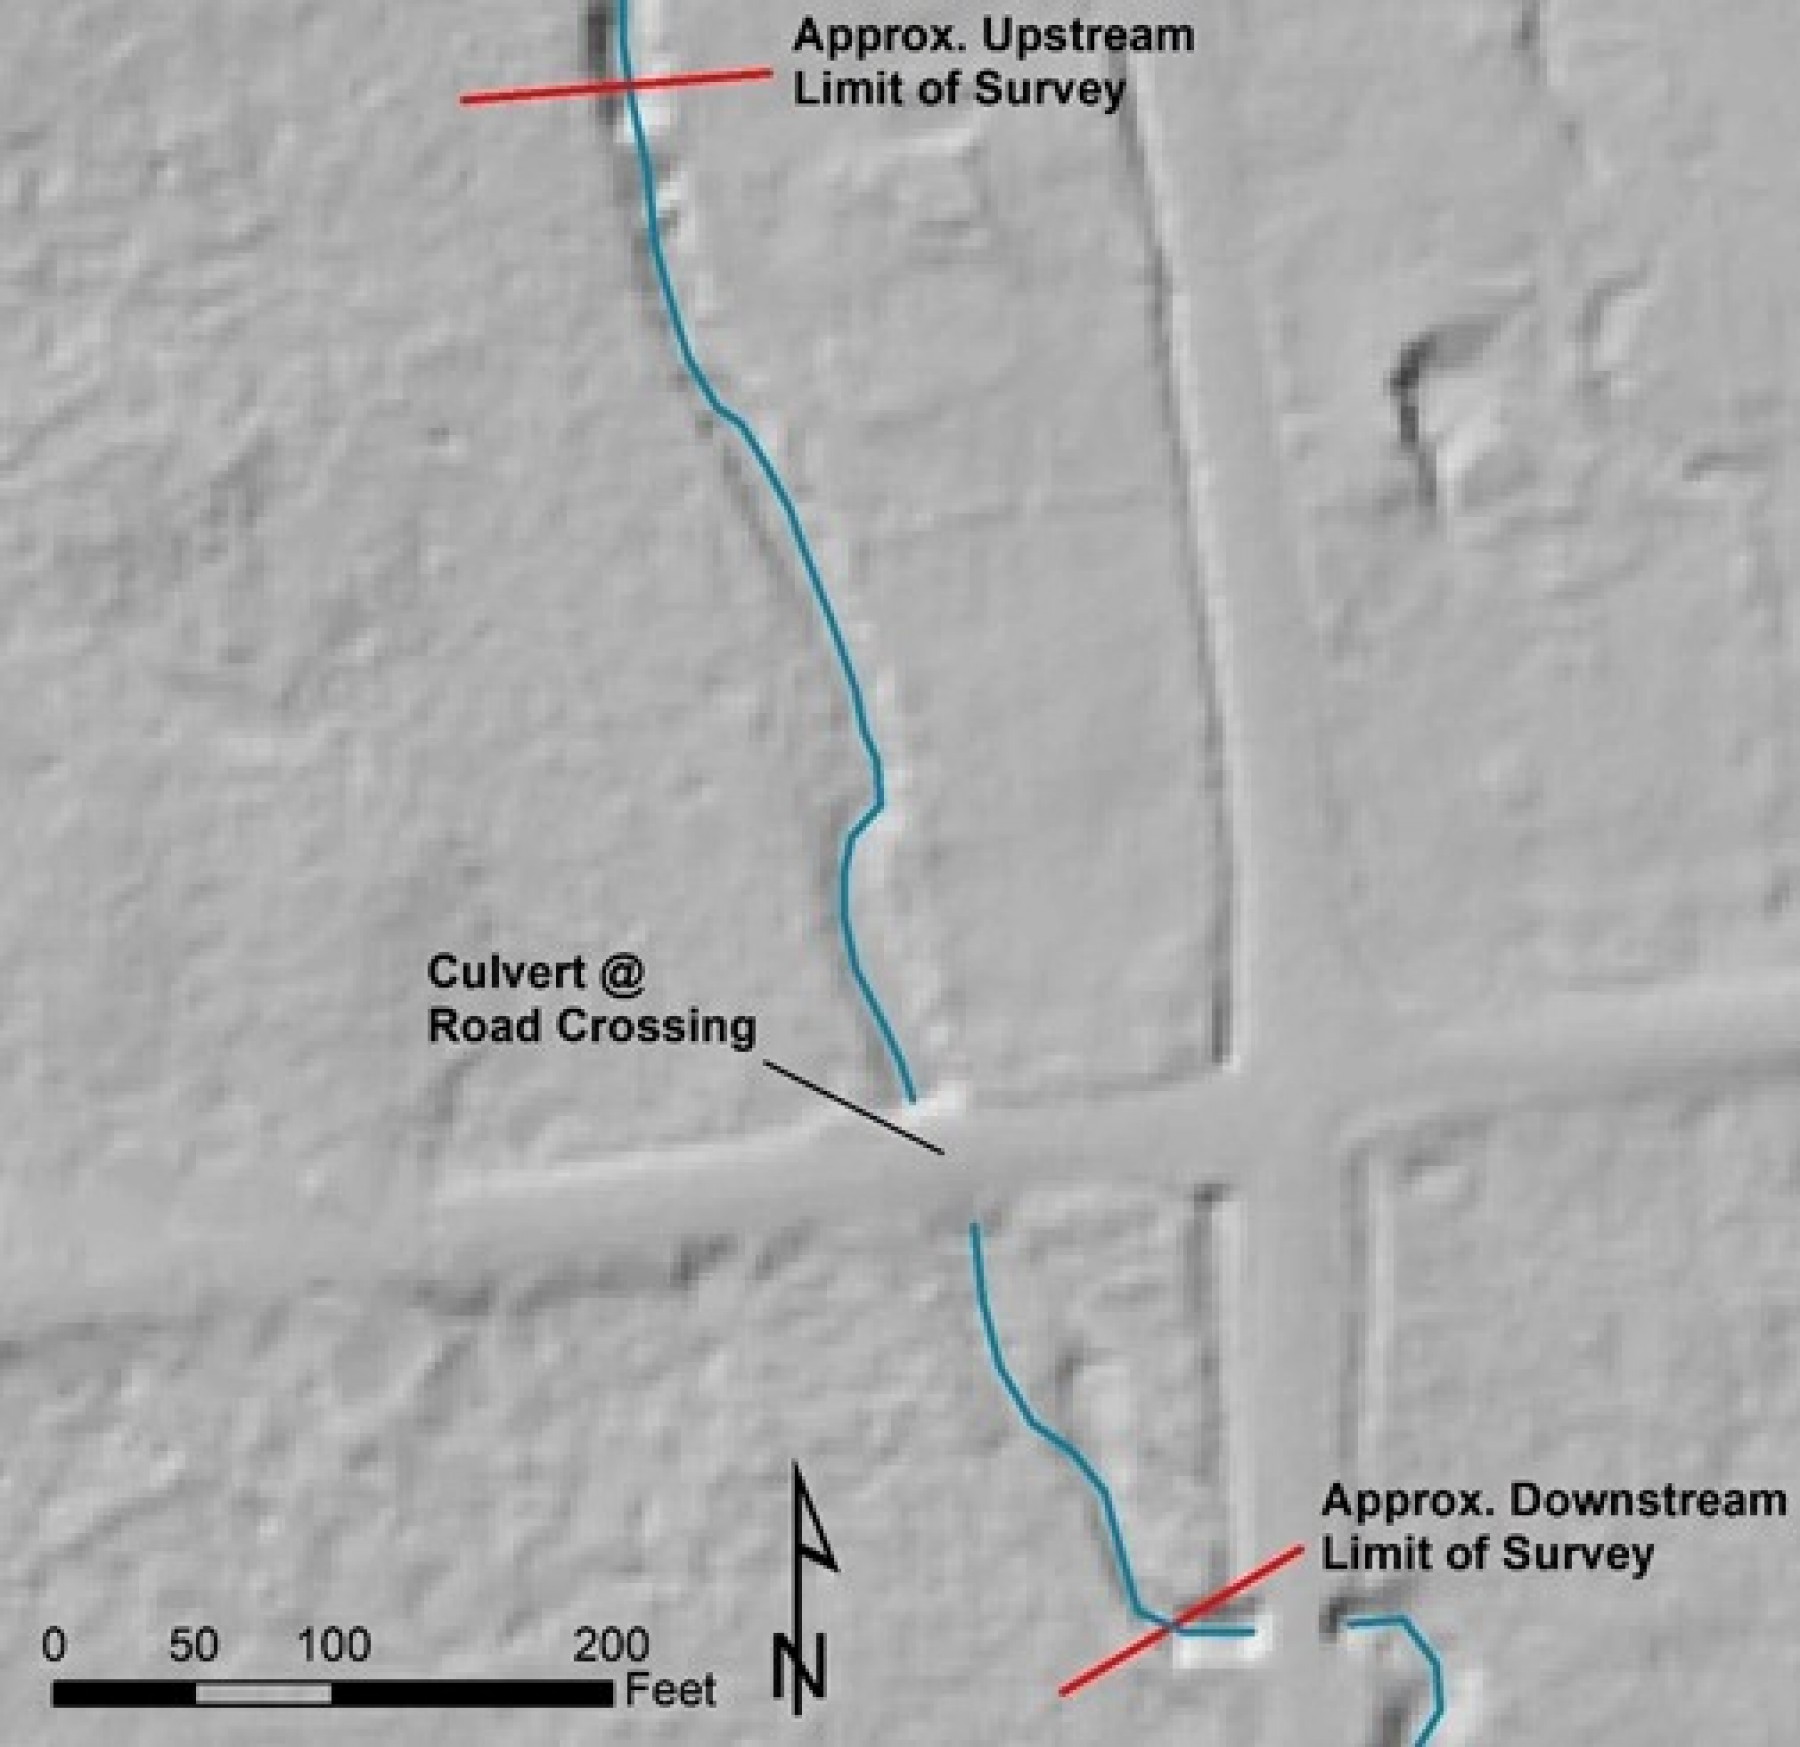
Figure 1. Shaded relief map of a stream recently surveyed as part of the design process for a climate-ready culvert. Stream flows south.
The slope of a stream channel is one of the characteristics that must be accurately identified in the process of surveying. As streamflow is driven by gravity, slope has a direct relationship to the velocity of water moving downstream. Climate-ready culverts try to mimic the existing slope of heathy sections of the stream. This ensures sediment competence - that is, gravel, cobble and boulders move efficiently in the system and without aggrading in the channel or within the culvert, which can constrict flow during high discharge events or prevent passage of aquatic organisms. The diagram below shows the existing slope of the stream in Figure 1.
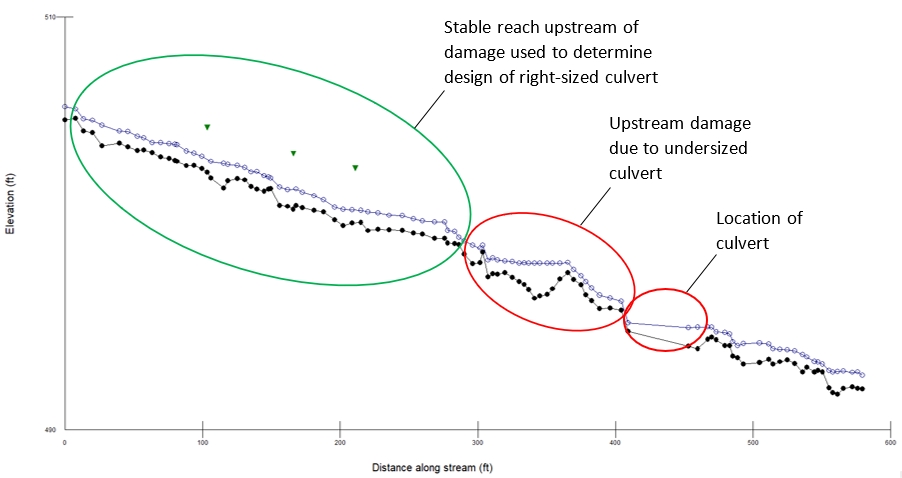
Figure 2. Longitudinal profile showing the slope of the stream channel from the map in Figure 1. The black-dotted line shows the elevation of the streambed, while the hollow blue-dotted line shows the elevation of the water surface. The elevation of bankfull discharge indicators are shown as inverted green triangles. Note the location of the culvert and the damaged section extending approximately 100 feet upstream of the existing culvert. The survey continued another 300 feet upstream of the damage to find a stable reach that will inform the design process.
Support our river restoration work for clean water and healthy streams. Give with confidence today!

In addition to slope, representative cross-sections are carefully measured to help determine the stable dimensions of the channel that have developed in response to typical channel-forming discharges occurring within the stream. The diagram below shows a representative cross-section measured at the location of the first upstream bankfull indicator shown in Figure 2.
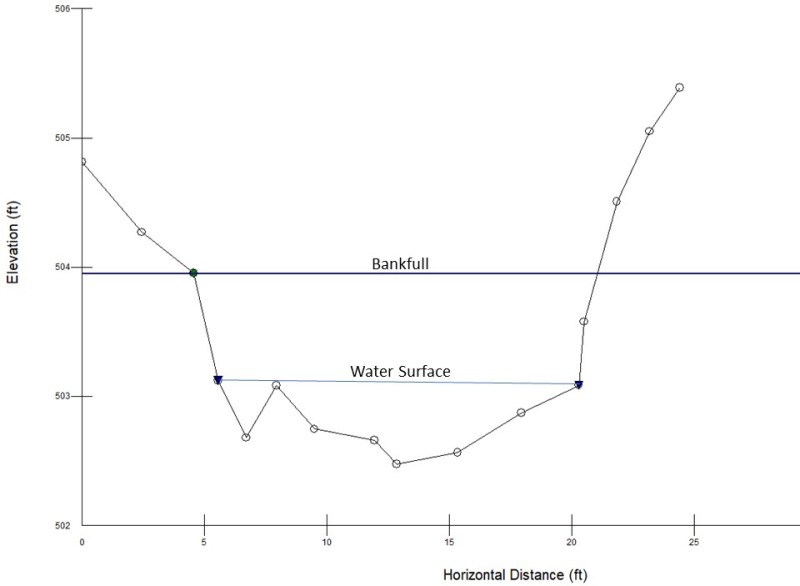
Figure 3. Representative cross-section of stream channel. Upper bold blue line shows the elevation of bankfull discharge indicator. Lower light blue line shows the elevation of the water surface during the survey. The irregular surface at the bottom of the channel is due to the presence of large cobbles and small boulders within the channel, which are common at this site.
After completing surveys of slope and cross sections, a pebble count is conducted at two of the cross section locations to aid in the estimation of bankfull discharge. A pebble count is a method for obtaining a representative sample of the material in the bed of the channel. The resulting data are plotted to determine the distribution of particle sizes. The distribution is used to assess channel roughness. This is required to estimate discharge along with slope and the hydraulic geometry determined from a cross section. The distribution of particle sizes also informs our understanding of the stream’s competence (the largest particles moved by the stream) and other characteristics of sediment transport.
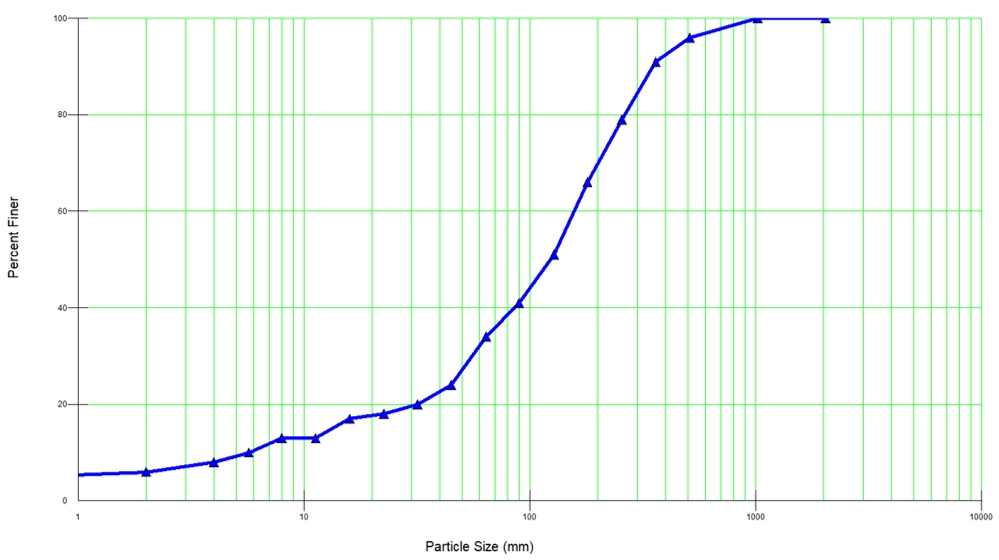
Figure 4. An example grain size distribution diagram based on data collected as part of a pebble count. The particle size (in millimeters) is shown on the horizontal axis, while the percentage of particles that are finer (or smaller) than any given particle size is shown on the vertical axis. For example, the diagram shows that 50% of the particles at this site have a diameter smaller than 125 mm (approximately 5 inches).
An accurate survey of slope, cross sections, and particle sizes is essential to the design of a right-sized climate-ready culvert. We need to understand how these streams move water and sediment before we can design a culvert that helps protect our infrastructure and our aquatic organisms. In a later story, we will further explore culvert design and see how our surveys inform that process.
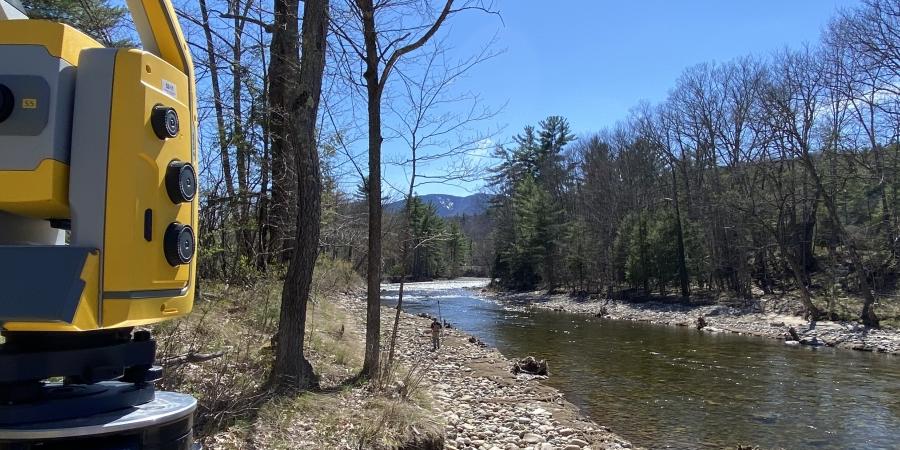
Story and diagrams by Gary Henry, Stream Restoration Manager. Top photo by Kelley Tucker: Surveying on the East Branch Ausable River
Sign-up for our e-newsletter to get weekly updates on the latest stories from the Ausable River Association.