Water is important for all living organisms, including humans. With increased development, demand for clean drinking water, and an ever-changing climate, there is more pressure than ever on our freshwater ecosystems. Careful observation and regular water quality monitoring is essential to provide the data necessary to protect them. Scientists who seek to understand current water quality or follow stream or lake health over time use three measures: physical, chemical, and biological. At the Ausable Freshwater Center, we've gathered essential physical data on our focal streams and lakes - understanding the watershed characteristics and, for example, the area, depth, and bathymetry of lakes or the channel characteristics of a stream. Our ongoing work includes the collection of basic chemical parameters year-round to track water quality throughout the Ausable River watershed. These include dissolved oxygen, pH, conductivity, specific conductance, and temperature collected consistently at multiple sites. An additional tool we use to understand water quality in our streams and lakes, is measurement of biological indicators such as fish, macroinvertebrates, and algae abundance and diversity. Most often, macroinvertebrates are used as bioindicators of water quality within streams.
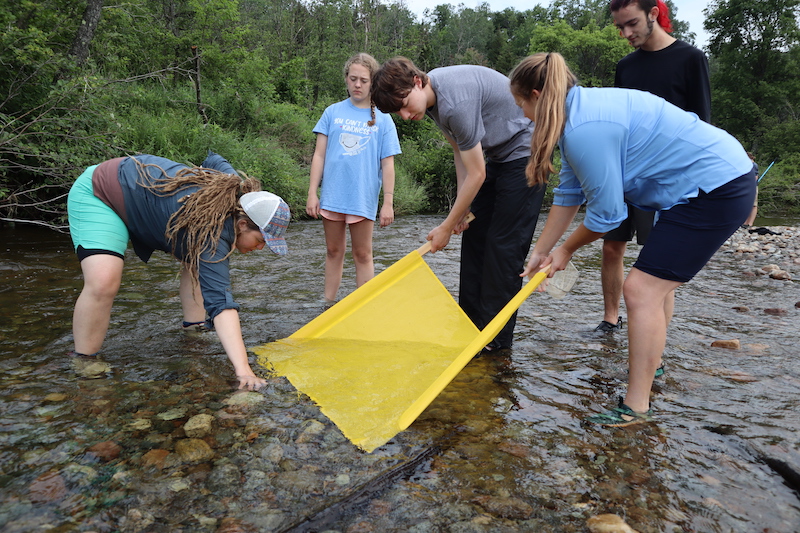
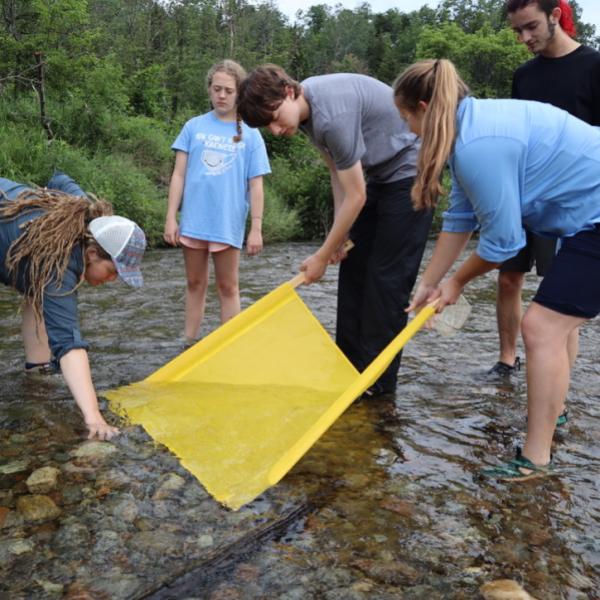
Figure 1. AFC staff demonstrating a kick net as a method of macroinvertebrate collection.
What are macroinvertebrates?
Macroinvertebrates are small organisms that lack a backbone but are large enough to be seen without a microscope. They comprise a diverse group of organisms including fly nymphs, worms, snails, and even crayfish, and live in a variety of different environments from fast-flowing mountain streams to ponds and lakes. Macroinvertebrates are often found attached to submerged rocks, logs, and vegetation or burrowed in stream or pond sediments. They are an integral part of the aquatic food web and play a major role in helping to circulate nutrients.
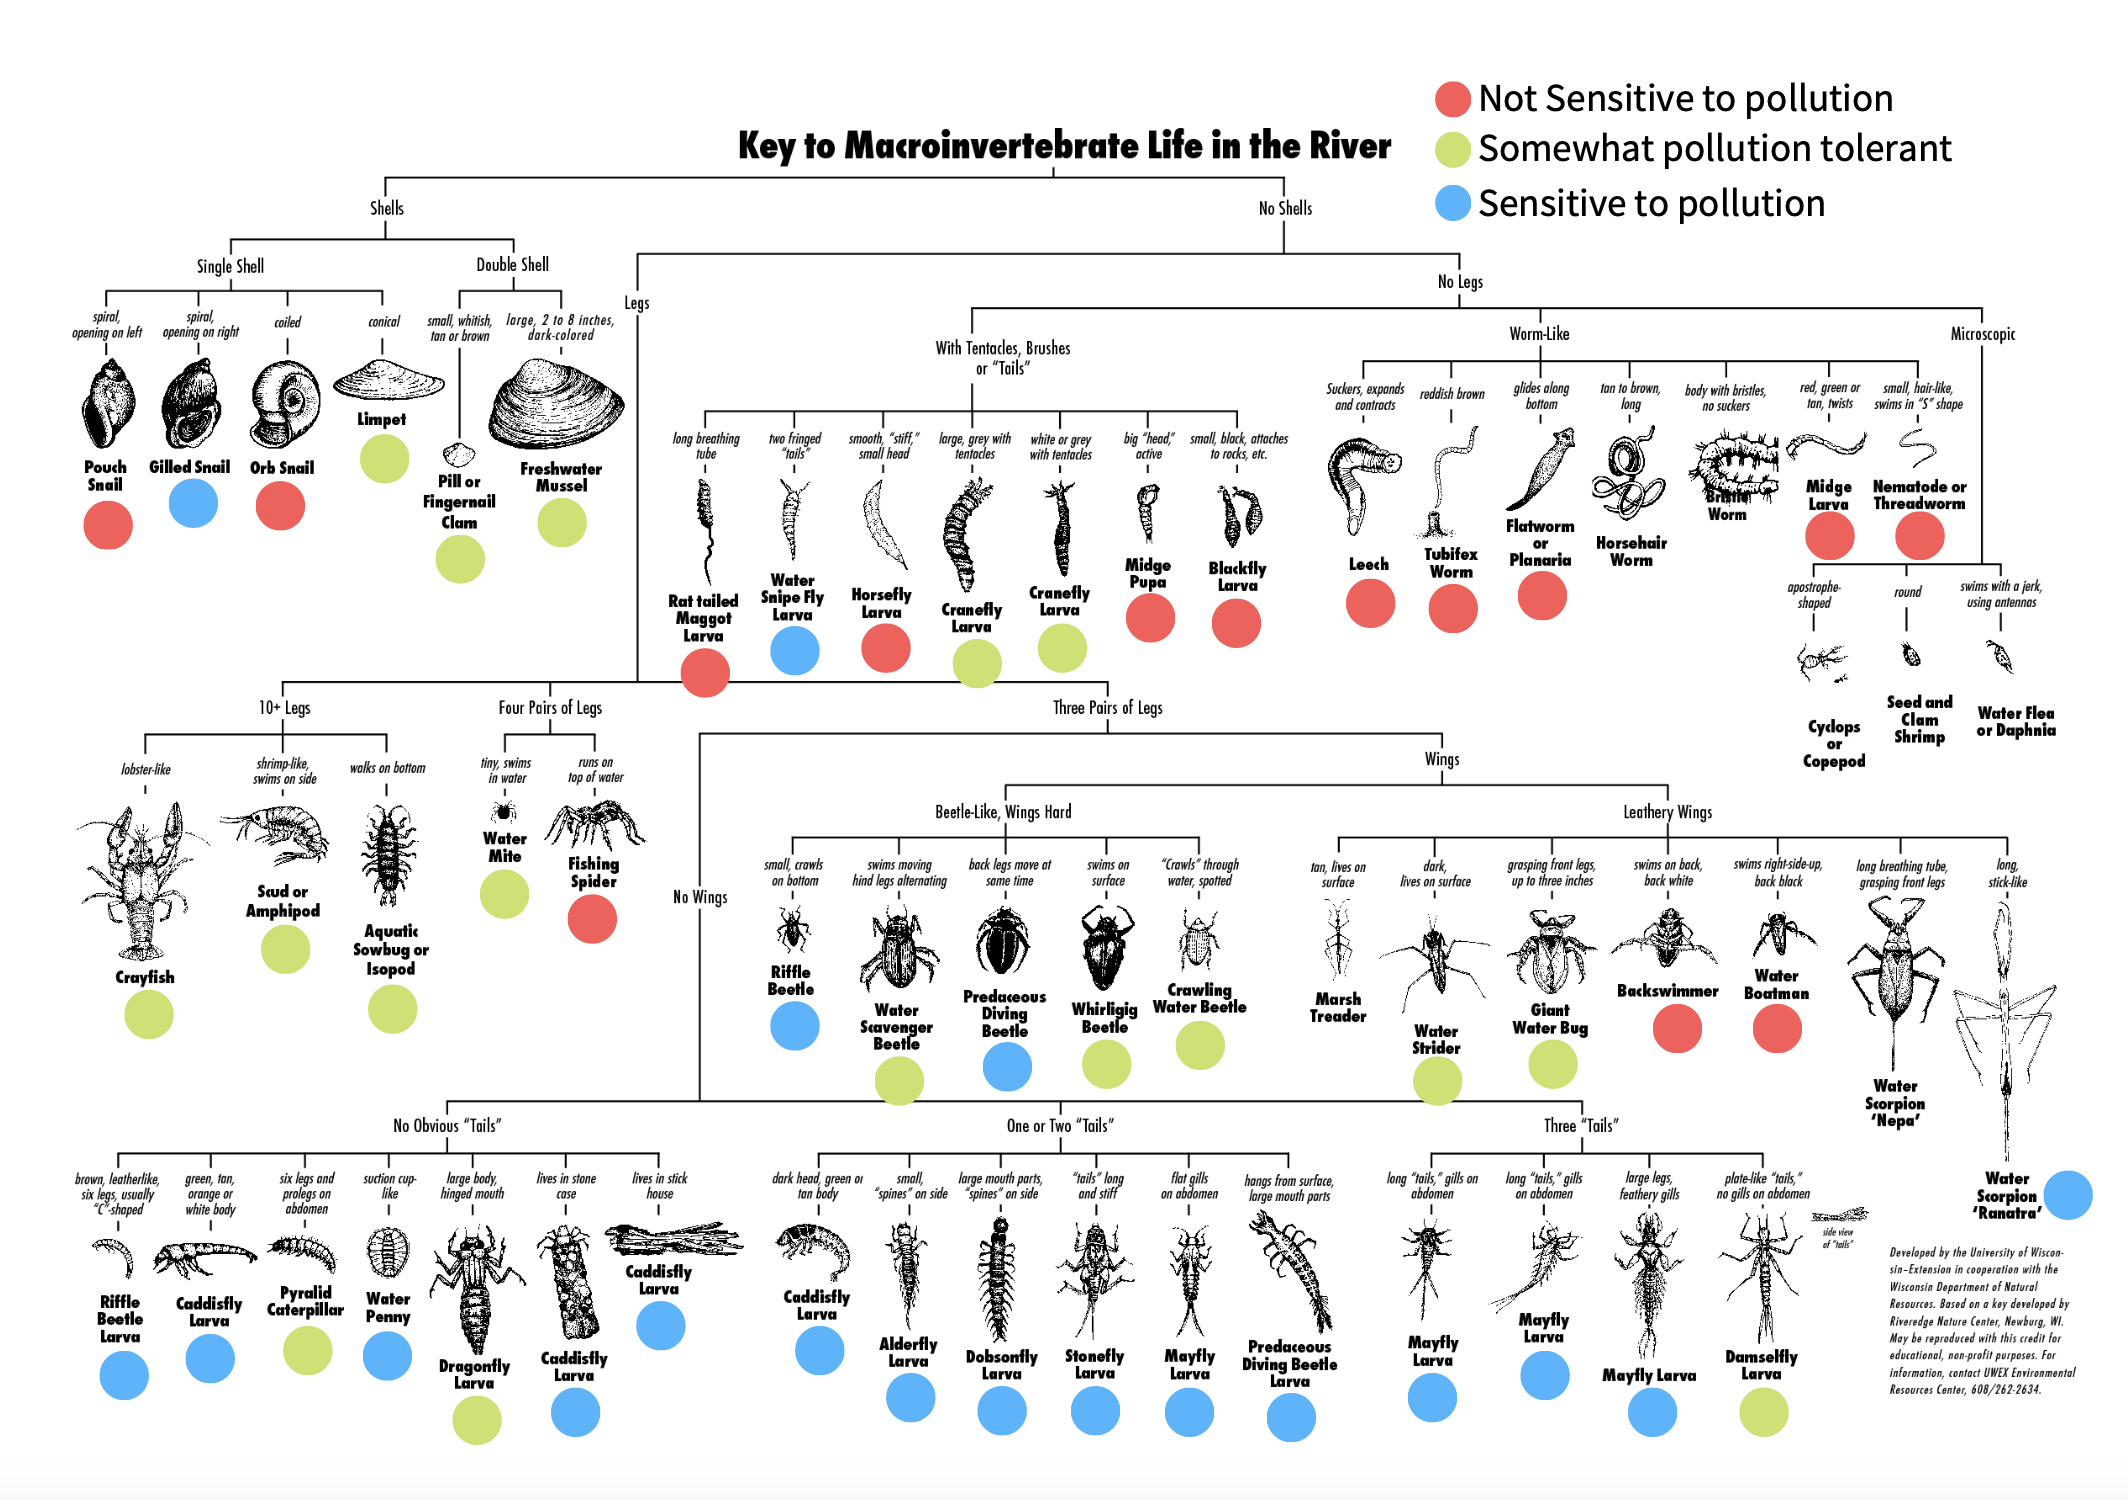
Figure 2. Dichotomous key for macroinvertebrates indicating species tollerance to pollution.
Why are they used as bioindicators?
Macroinvertebrates are relatively easy to collect and identify, making them a common choice when evaluating biological measures of water quality. Because they spend most or all of their life in the water, they can give us information about water quality over a period of time rather than just a snapshot of water quality at the time of data collection. Macroinvertebrates have low mobility, so they are unable to avoid pollutants if there are any in that stretch of the stream. They can therefore show the cumulative effects of pollutants in that reach. Within each taxonomic group of macroinvertebrates, there is a wide range of tolerances to pollution (Figure 2). Therefore, the presence or absence of species can be used to indicate poor, marginal, good, or excellent water quality. There are several different biological indices (which use the presence of organisms to infer information about the habitat they live in) that use macroinvertebrates to examine stream health, but the EPT index is commonly used for rapid assessments of water quality.
Support our water quality monitoring work for clean water and healthy streams. Give with confidence today!

EPT Index
The EPT Index uses pollution tolerance levels of different macroinvertebrates to indicate water quality. It is named after the three orders of macroinvertebrates that are assessed: Ephemeroptera (mayflies), Plecoptera (stoneflies), and Trichoptera (caddisflies) (Figure 3). These orders are sensitive to decreased water quality and are not found in areas with pollution or disturbance. The EPT Index looks at taxa richness, or the number of different species, within a sample, using the number of distinct taxa within the three orders to determine an EPT Index score. That number is compared to an EPT rating chart to determine the water quality. The higher the EPT Index, the better the water quality. EPT can also be calculated as a percentage. In this case, the number of EPT taxa is compared to the total number of taxa found in the sample. A high percentage of EPT indicates good water quality.
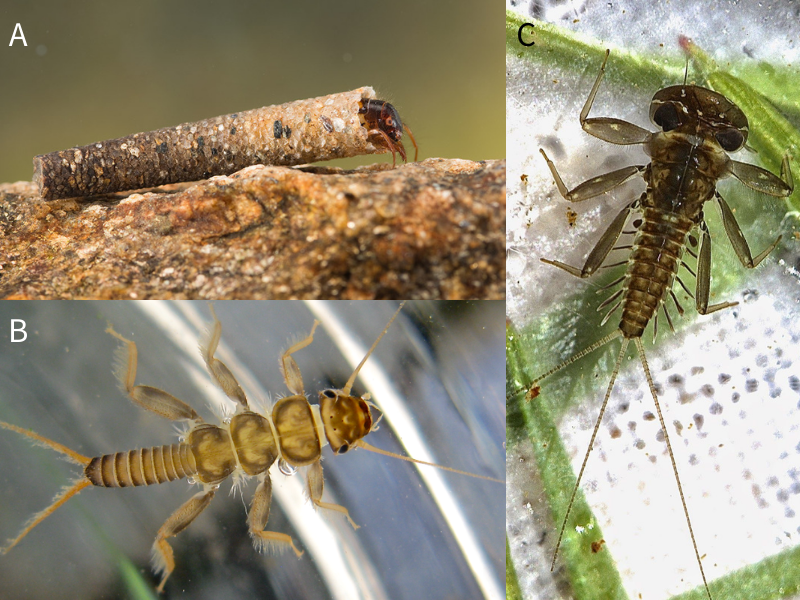
Figure 3. Caddisfly larvae, Trichoptera (A); Stonefly nymph, Plecoptera (B); mayfly nymph, Ephemeroptera (C). Pictures by Jan Hamrsky, Dave Huth, and Bob Henricks.
Looking at the big picture
Looking at chemical, physical, or biological measures by themselves will give a good indication of water quality, but none of them tells the whole story. Using bioindicators indicates water quality, but they do not tell why. A lack of sensitive species within a sample, for example, indicates that the water quality is poor but doesn’t indicate the problem. Only when physical and chemical parameters are also measured can we begin to determine the problem at a site. For this reason, bioindicators are a great way to rapidly assess the water quality of a site and to determine areas that may need management and should be followed up with other data collection methods.
Story by Liz Metzger. Top photo by Dave Huth
Sign-up for our e-newsletter to get weekly updates on the latest stories from the Ausable River Association.